Crypto battlefield — a live bitcoin liquidation map
The DeltaNode crypto battlefield renders Bitcoin order flow as a 3D war table. Bears hold the left flank, bulls hold the right, and a cyan front line sits on the current price, so the balance of the book is legible at a glance instead of buried in a depth chart.
Resting order-book walls are drawn as armour, executed flow as infantry, and every explosion on the field is a real liquidation printing on Binance futures. It is a bitcoin liquidation map you can read in a second: where size is stacked, which side is losing ground, and what price level the fight is being decided at.
Open Battlefield→Liquidation heatmap live — the 5-minute snapshot
The live liquidation snapshot runs on a 5-minute timeframe and plots resting liquidity either side of price as a heatmap: the brighter the band, the more size is parked at that level. Clusters above price and clusters below it are weighted by how close they sit, because a wall 0.1% away pulls far harder than the same size 2% out.
That is what makes a bitcoin heatmap today useful rather than decorative — it shows the levels price is likely to be drawn toward, and the pockets it can sweep through with nothing to stop it.
Open Heatmap→Market breadth crypto — and live derivatives data
Market breadth answers a question a single chart cannot: is this move the whole market, or one coin? DeltaNode tracks how many open markets are green over the last five minutes and scrolls the result as a live tape, so a rally on thin participation is obvious immediately.
Underneath it sits the derivatives layer — open interest and its recent history, funding rates, the futures basis, long/short account ratios, taker buy/sell pressure and order-book imbalance. Together they turn a price move into a positioning story: whether it is being driven by fresh leverage, by shorts covering, or by spot demand.
Open OI Heatmap→Crypto market clock — live exchange sessions
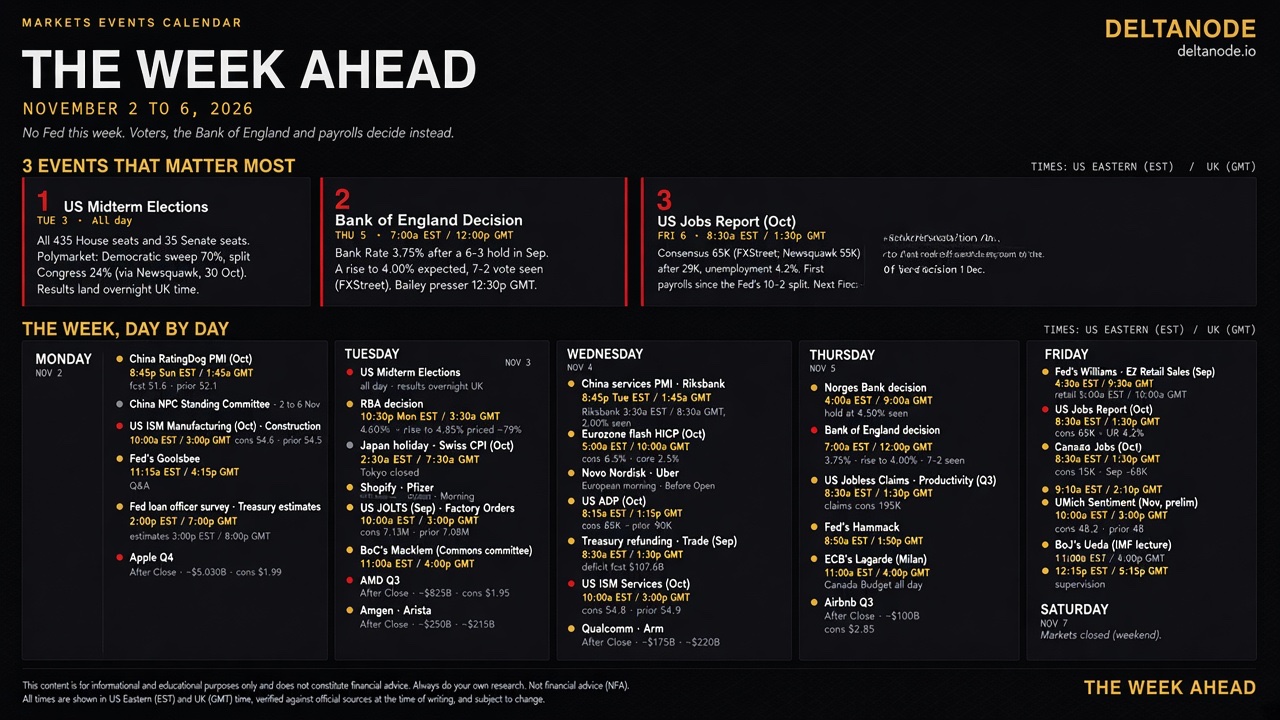
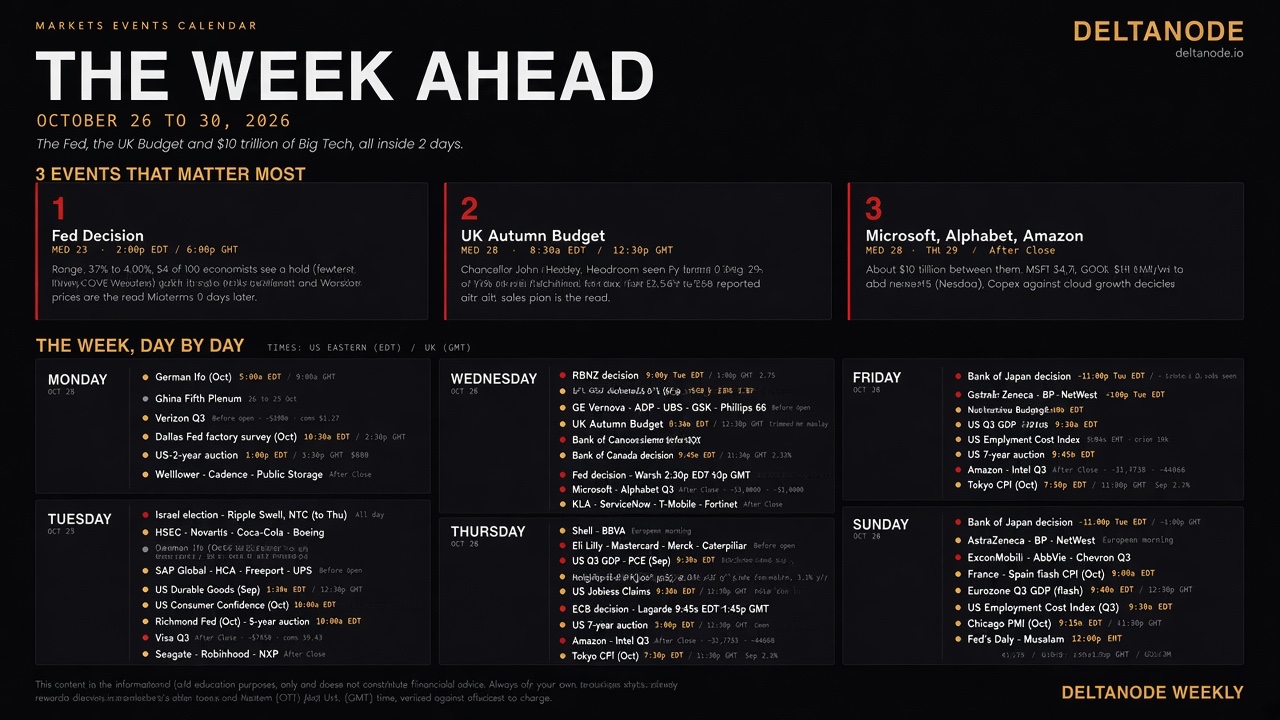
Crypto trades around the clock, but the liquidity behind it does not. The DeltaNode crypto market clock plots the world's exchange sessions on a live map — NYSE, NASDAQ and CME futures, the London Stock Exchange, Euronext and Frankfurt, Tokyo, Hong Kong, Shanghai, Korea, Mumbai and the ASX — alongside the London and New York forex sessions.
Each card shows whether that session is open, how far through it has run, and how long until the next bell in its own local time. Those handovers are when volatility arrives: crypto has no opening bell of its own, so knowing which desks just sat down is the difference between reading a breakout and reading a session change.
Open Market Clock→The full workspace adds multi-timeframe confluence scoring, an AI research desk, the open-interest map, paper trading and a saveable panel layout. Open the terminal (sign-in required), or ride the BTC chart in the arcade while you wait on the market.